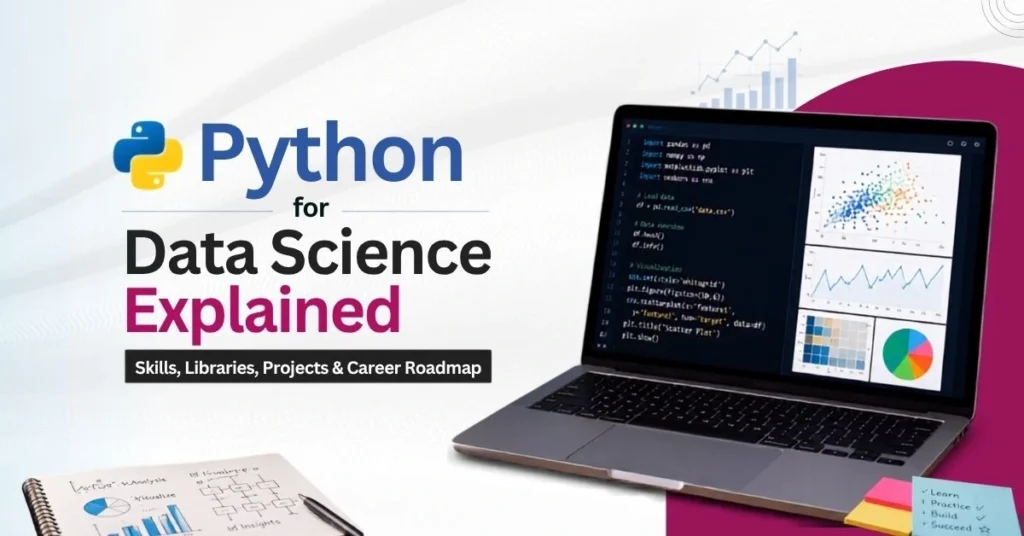
Learning Python by itself doesn’t make someone a data analyst. The harder part is knowing which Python skills matter for analytics, how they work alongside SQL, Excel and BI tools, and how to turn those skills into analysis that answers actual business questions.
At Python Class Singapore, we’ve seen this gap play out again and again: people finish a Python course and know the syntax well but still can’t tell you which chart answers a business question or what a spike in a dataset actually means. This roadmap walks through what a data analyst does with Python day to day, the specific skills and libraries worth learning, how to move from raw data to a business recommendation, which projects to build, and how to put it all together into a portfolio. Choosing a structured python for data analytics course path helps close that gap between knowing syntax and applying it to genuine business problems. If you already know Python basics and want to know what comes next, this is where to start.
What Does a Data Analyst Do With Python?
Day to day, a data analyst working with Python spends time on a fairly consistent set of tasks:
- Pulling data from files, databases, or reports
- Cleaning messy datasets before any analysis can begin
- Exploring the data to find patterns worth digging into
- Calculating metrics and summary figures tied to a business question
- Building visualisations that make patterns easy to explain
- Automating repetitive analysis so it doesn’t need to be redone by hand
- Communicating findings to people who won’t read the code
Python is one tool inside this workflow, not the whole workflow. Knowing the syntax doesn’t mean you automatically know how to clean a messy sales export, pick the right chart for a question, or turn a pattern into a recommendation someone can act on. Those are separate skills layered on top of the language, and they’re what makes someone genuinely useful as a data analyst.
What Skills Do You Need to Become a Data Analyst With Python?
To become a data analyst using Python, the skill map generally aligns with what you’d learn in a solid python data analysis course:
- Python fundamentals
- Pandas
- NumPy
- Data cleaning
- Data manipulation
- Exploratory data analysis
- Data visualisation
- Basic statistics
- SQL
- Excel
- Power BI or Tableau
- Business problem-solving
Python fundamentals give you the base to write and read code. Pandas and NumPy are what you’ll use daily to load, filter, and calculate against datasets. Data cleaning and manipulation matter because data rarely arrives ready to analyse. Exploratory data analysis and basic statistics help you understand what the data is telling you before you visualise anything. Visualisation turns that understanding into something others can read at a glance. SQL, Excel and BI tools matter because business data doesn’t live in one format or one place, and a data analyst who only knows Python will hit a wall quickly. Business problem-solving ties it all together, since it decides what question you ask the data in the first place.
How to Start Data Analytics With Python
A practical sequence to follow:
- Python fundamentals — variables, conditions, loops, functions, and basic data structures. Learners who need to build this foundation first can follow a guide to learn Python from scratch and get comfortable with core syntax and logic before moving into analytical libraries.
- NumPy and Pandas — arrays and DataFrames, the two structures almost all Python-based analysis is built on.
- Data cleaning — handling missing values, duplicates, and inconsistent formatting.
- Data exploration — looking at distributions, groupings, and early patterns.
- Data visualisation — turning findings into charts that communicate clearly.
- Statistics — understanding averages, distributions, correlation, and what a result means.
- SQL and Excel — connecting to how business data is commonly stored and reported.
- Power BI or Tableau — building dashboards others in the business can use directly.
- Projects — applying all of the above to datasets that resemble actual work, not textbook exercises.
A python course for beginners works well at this stage for anyone still building confidence with core concepts. Getting comfortable with python language basics for beginners gives you the footing needed before Pandas and NumPy start making sense.
Python Skills a Data Analyst Should Learn First
Python fundamentals: variables, conditions, loops, functions, lists and dictionaries
- Pandas: DataFrames, filtering, grouping, aggregation, merging, handling missing values
- NumPy: arrays, numerical operations
- Visualisation: Matplotlib, Seaborn
Useful supporting skills include reading CSV and Excel files directly into Python, working with dates, and basic error handling so a script doesn’t fail silently on bad data.
Python Libraries for Data Analytics: Pandas, NumPy, Matplotlib and Seaborn
Four libraries cover most of the daily work:
Library | What it’s used for |
Pandas | Cleaning, filtering, transforming and analysing data |
NumPy | Numerical calculations and array operations |
Matplotlib | Creating charts |
Seaborn | Statistical visualisation |
These usually work together in a simple flow:
CSV → Pandas → Clean → Analyse → Matplotlib or Seaborn → Insight.
A raw file loads into Pandas, gets cleaned and shaped into something usable, gets analysed to answer a specific question, then gets visualised so the answer is easy to read and share. Once you’re comfortable here, exploring python machine learning for beginners is a natural next step toward more advanced predictive analytics.
Data Cleaning: The Skill Beginners Often Underestimate
Data cleaning is often treated as a small step before the “proper” analysis, but it’s usually where most of the time actually goes. Common problems include:
- Missing values
- Duplicate records
- Incorrect data types (numbers stored as text, dates stored as strings)
- Inconsistent categories (“NY”, “New York”, “new york” all meaning the same place)
- Date formatting differences across sources
- Outliers that skew averages and totals
- Empty rows or columns left over from exports
Good analysis depends on the quality of the data feeding into it. A dataset that moves from messy to clean to validated to analysis-ready is what makes every step after it dependable. Skipping or rushing this stage tends to show up later as wrong totals or charts that look fine but aren’t accurate.
How to Use Python for Data Analysis: From Questions to Insights
Data analysis works best when it starts from a business question, not from the data itself. A typical path looks like this:
- Business question: Which product category generated the highest revenue?
- Prepare data: Load the relevant sales data and clean it.
- Analyse: Group by category, filter by time period, aggregate revenue, compare across groups.
- Visualise: Build a chart that makes the comparison clear at a glance.
- Interpret: Read what the chart is showing, including anything unexpected.
- Recommend: Turn the finding into something a decision-maker can act on, such as which category deserves more marketing budget.
Knowing how to group and filter data is a coding skill. Knowing what question to ask and what the result means for the business is the analytical skill that makes the first one useful.
Data Visualisation With Python: Choosing the Right Chart
A handful of chart types answer most common questions:
- Bar charts for comparing values across categories
- Line charts for showing trends over time
- Scatter plots for showing the relationship between two numeric variables
- Histograms for showing how values are distributed across a range
Common mistakes to avoid: picking a chart type that doesn’t match the question, cramming too much into one chart, leaving out axis labels or titles, using a scale that exaggerates or hides a difference, and building a chart without a clear question behind it.
Do You Still Need SQL, Excel and Power BI If You Know Python?
Knowing Python doesn’t remove the need for these tools. Each plays a different role in the same workflow:
Tool | Role |
Python | Cleaning, analysis, automation |
SQL | Extracting and querying data stored in databases |
Excel | Spreadsheet analysis and quick reporting |
Power BI | Interactive dashboards and business reporting |
Business data commonly lives in a relational database, which is where SQL comes in before Python ever touches it. To understand how Python and SQL for data analytics complement each other and which one is worth learning first, this comparison covers it in more depth. Most working data analysts end up using both, since they solve different parts of the same job.
Python Data Analytics Projects to Build
Projects are what turn learning into proof of ability:
- Sales Analysis — Pandas, grouping, visualisation. Questions about which products or regions perform best, backed by charts and a summary of what’s driving performance.
- Customer Analysis — data cleaning, segmentation, trend analysis. Identifying which customer segments are most active or at risk of leaving.
- E-commerce Analysis — merging multiple datasets, calculating KPIs. Combining order, product and customer data into one analysis that answers a broader business question.
- Marketing Campaign Analysis — conversion metrics, comparisons across campaigns, visualisation. Identifying which channels or messages produced the best return.
- Business Performance Dashboard — Python analysis feeding into BI tools, closer to what a business would use on an ongoing basis.
Each project should follow the same structure: dataset, question, skills applied, output produced, and the business insight that came out of it. That structure is what makes a project readable to someone reviewing your work, not just a script that runs.
Building a Python Data Analyst Portfolio
A strong portfolio doesn’t just show code. It shows how you think through a problem. Each project should include the business problem, the dataset used, the cleaning steps taken, the analysis performed, the visualisation created, the findings, and recommendations based on those findings, along with documentation explaining the reasoning behind each step.
Two people can write nearly identical Pandas code and end up with very different portfolios, depending on whether they can explain why they made each choice and what it means for the business behind the data.
Start Your Data Analytics Journey With Python
- Python Fundamentals — understand programming logic
- Pandas and NumPy — work comfortably with datasets
- Data Cleaning — handle messy data
- Data Analysis — answer business questions with data
- Visualisation — communicate findings clearly
- SQL and Excel — work with common business data sources
- Power BI or Tableau — build reports others in the business can use
- Projects — apply everything together on realistic problems
- Portfolio — demonstrate practical ability to someone hiring for the role.
While self-study through documentation and open datasets is a solid start, structured guidance tends to speed things up considerably. If you’d prefer instructor-led training with guided projects, a Python data analytics course in Singapore can help you build these skills through hands-on exercises rather than working it all out alone.
How Long Does It Take to Become a Data Analyst With Python?
There’s no fixed timeline that applies to everyone, and a number given without context isn’t especially useful. What matters more is the progression:
Python basics → data analysis → supporting tools → projects → portfolio.
How long each stage takes depends on prior programming experience, how consistently someone practises, and how much depth goes into the projects along the way. Someone with prior coding experience will likely move through the fundamentals faster, but building the judgment to know what question to ask and what a result means tends to take longer than learning the syntax itself, regardless of background.
Common Mistakes When Learning Python for Data Analytics
- Trying to learn all of Python before touching any data
- Memorising syntax without understanding when to use it
- Spending too little time on Pandas, since it’s what most daily analysis runs on
- Avoiding SQL entirely, then hitting a wall when data lives in a database
- Following tutorials step by step without building an independent project
- Skipping data cleaning and jumping straight to analysis
- Creating charts without interpreting what they show
- Building projects without a business question behind them
- Trying to learn too many libraries at once instead of going deep on the core few
- Not documenting projects, which makes them far less useful as portfolio pieces later
Conclusion
Becoming a data analyst with Python isn’t about learning the language in isolation. It’s about combining Python fundamentals, Pandas and NumPy, data cleaning, analysis, visualisation, and supporting tools like SQL, Excel and Power BI into a workflow that can answer business questions. Some learners prefer working through this on their own, while others find it easier alongside structured Python training in Singapore, where guided practice and feedback can smooth out the harder parts. Either way, projects and a documented portfolio are what turn that workflow into proof you can do the job, and that’s what this roadmap comes down to in the end.